It started, as these things often do, with a scroll on X.
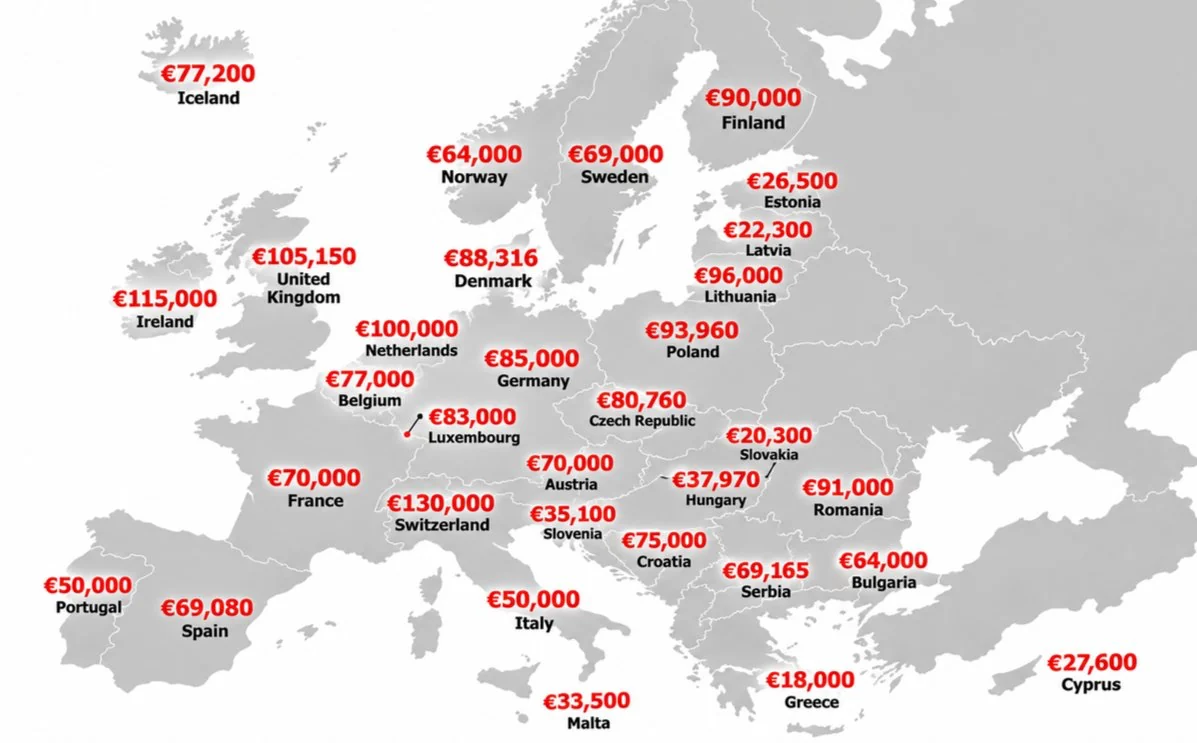
A map of Europe popped up in my feed: every country labelled with a big red euro figure, supposedly the average annual salary. Switzerland at €130,000. The UK at €105,150. Poland at €93,960, ahead of Germany. Romania at €91,000. Hungary at €37,970.
It looked authoritative. Clean design, precise numbers, nothing obviously off at first glance. And it was being shared widely.
Then the community stepped in. A Community Note was added to the post, flagging that the figures were inaccurate (you can read it here). People in the replies were saying the same thing: the figures did not add up. Poland out-earning Germany? Romania close to Finland? Anyone who has worked across Central and Eastern Europe knows that is not the reality.
So I did what I do with tracking data for clients: I went looking for the source.
Tracing the original
It did not take long. The map is a distorted copy of a 2024 map of average full-time salaries in Europe published by Visual Capitalist, built on Eurostat data for EU countries and OECD data for the UK, Switzerland, Norway and Iceland.
Some figures on the viral version were correct: Iceland, Norway, Luxembourg, Slovakia, Greece, the Baltic states, Slovenia, Malta and Cyprus all matched the original. Many others were wildly off:
- Switzerland was shown at €130,000. The real figure is about €75,000.
- The UK was shown at €105,150. The real figure is about €51,700.
- Hungary was shown at €37,970. The real figure is about €18,500.
- Bulgaria was shown at €64,000. The real figure is about €15,400.
- Poland (€93,960) and Romania (€91,000) look like figures in local currency, zloty and lei, with a euro sign stuck in front. In euros, both are around €21,000.
A mix of doubled numbers, wrong currencies and a few correct anchors is exactly what makes a fake convincing. The correct figures give it credibility; the wrong ones give it virality.
Version one: the corrected 2024 map
First, I rebuilt the map with the actual 2024 data, so it could be compared like for like with the one circulating.
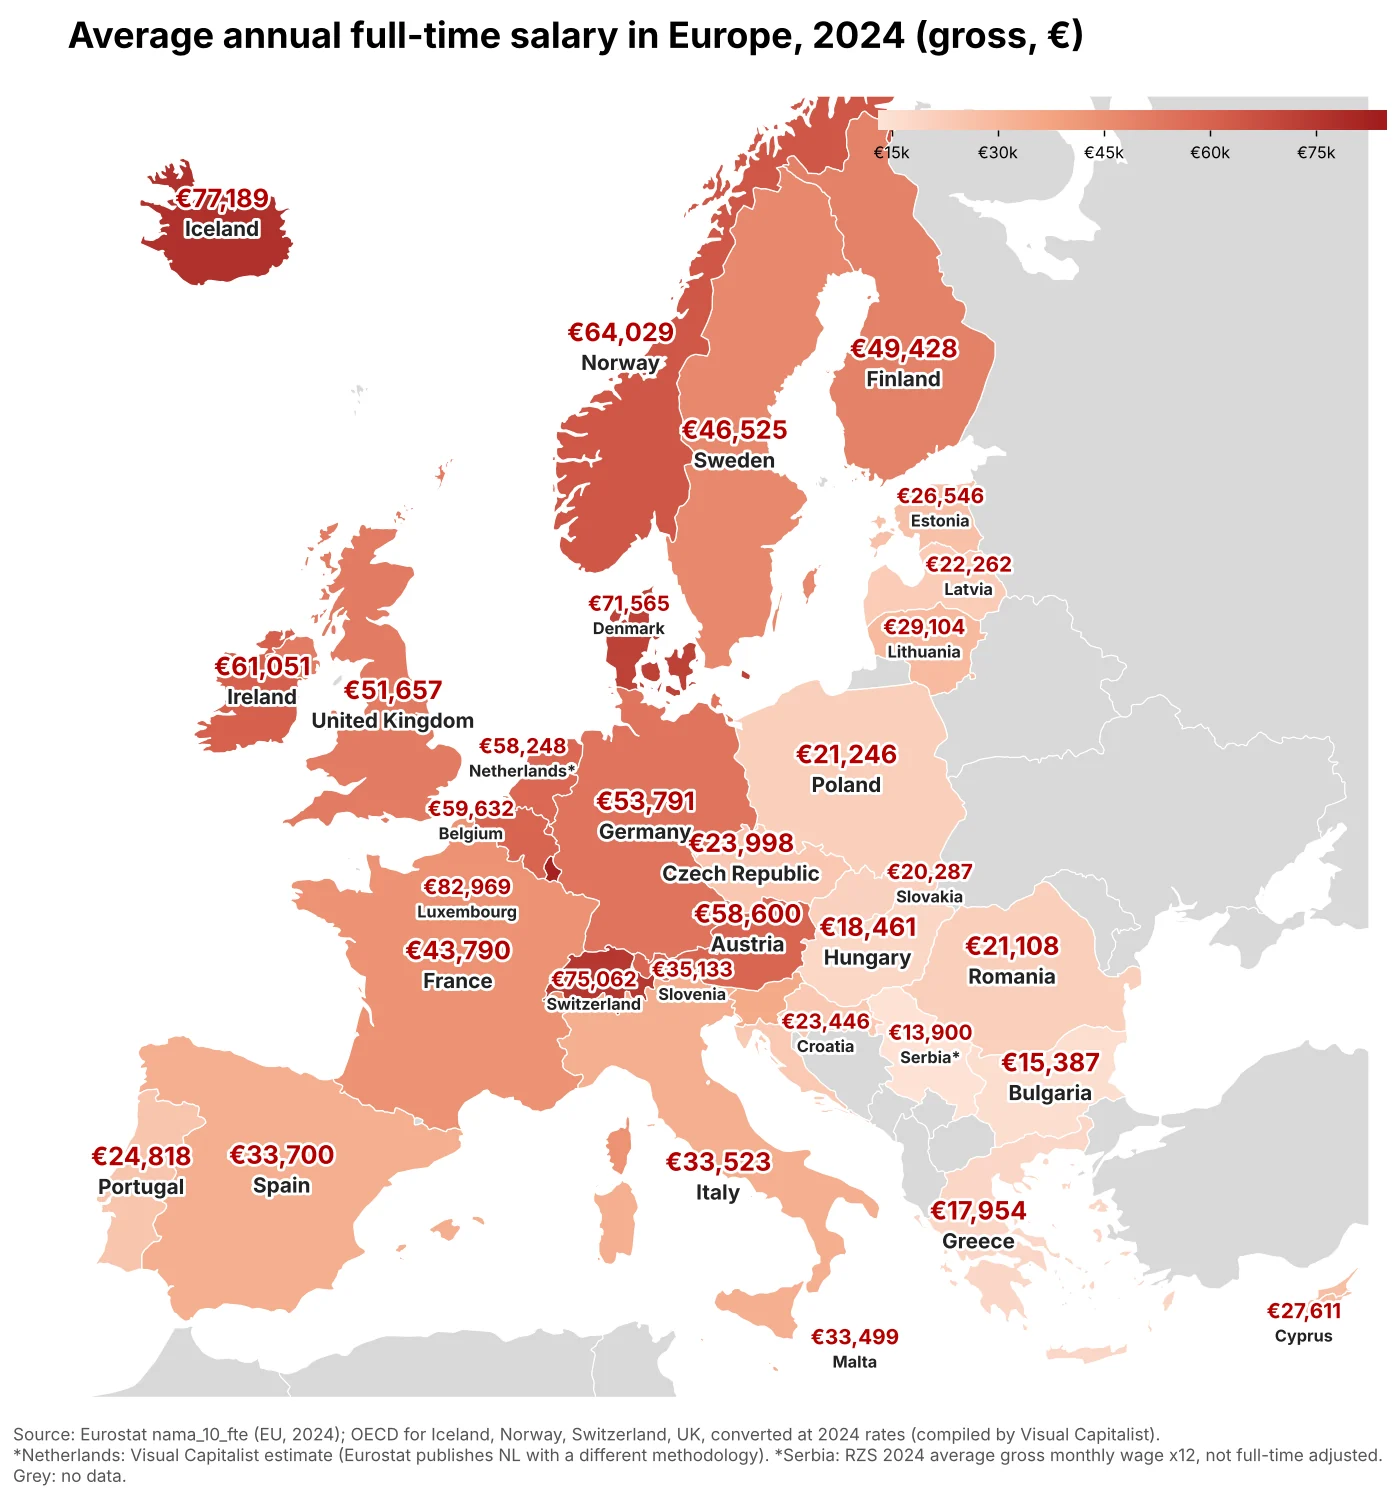
The picture changes completely. Luxembourg, Iceland, Switzerland and Denmark lead. Central and Eastern Europe sits in a tight band of roughly €18,000 to €30,000, and Bulgaria, Greece and Hungary are at the bottom of the table.
Version two: the latest data available
Then I wanted it as fresh as possible. A full 2026 figure does not exist yet, as the year is not over, but Eurostat published the 2025 data on 6 November 2026. The EU average came in at around €41,500, up 4.3% on the previous year.
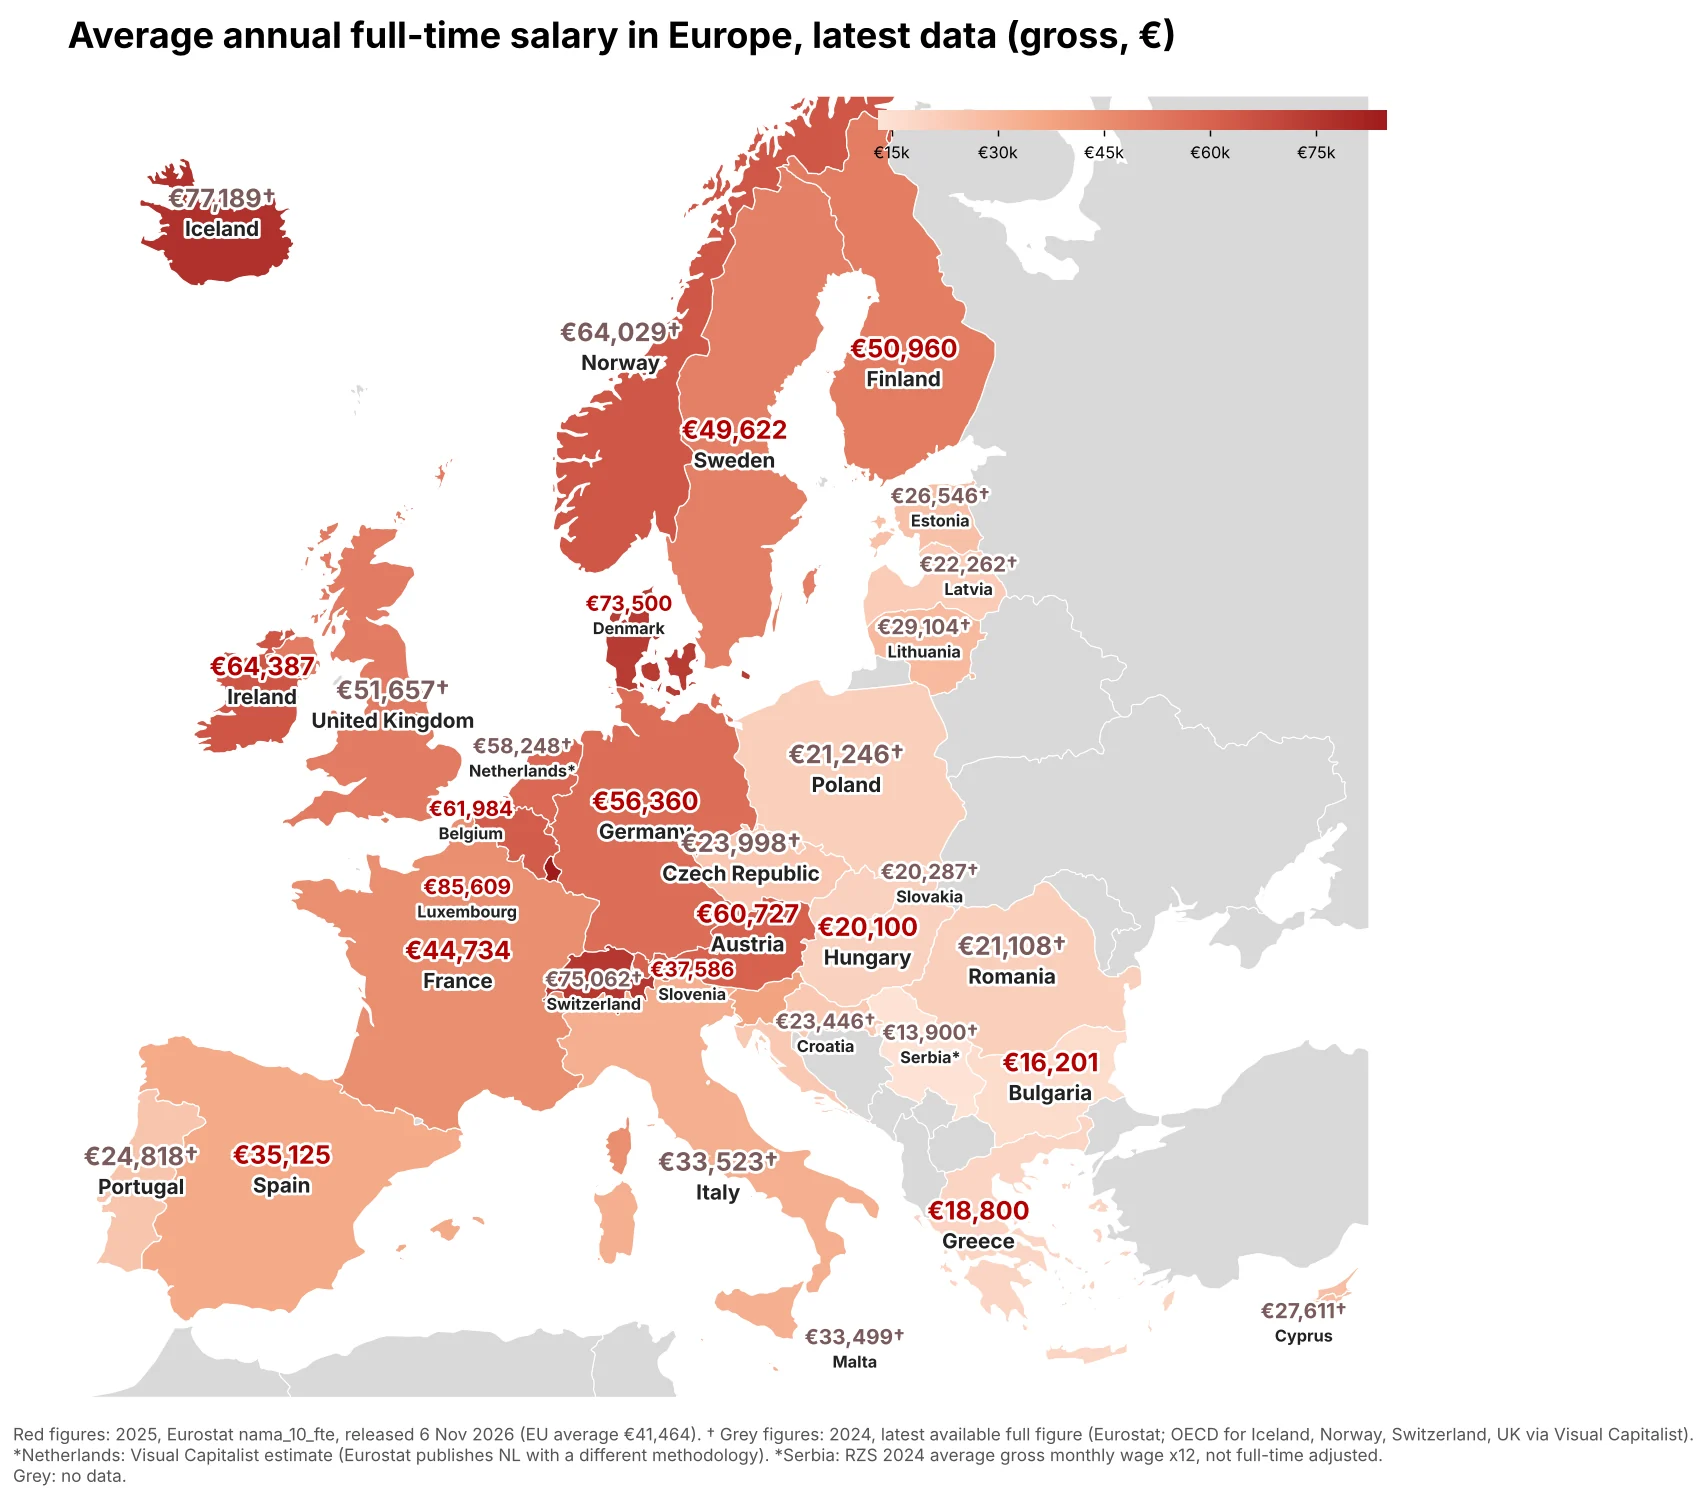
Luxembourg is now at €85,600, Denmark at €73,500 and Ireland at €64,400. Hungary rose to €20,100, still among the lowest in the EU alongside Greece (€18,800) and Bulgaria (€16,200).
For transparency, I kept two things honest on the map. Where the 2025 breakdown was not yet public, the 2024 figure stays, clearly marked. And I deliberately did not add the OECD's 2025 numbers for Switzerland and the UK: they come from a different survey that leaves out sectors such as agriculture, public administration, education and healthcare, so they run noticeably higher. Mixing the two would have recreated the very problem I was trying to fix.
Then I thought: what about marketing?
I work in marketing, so the obvious next question was whether the same map could be done for marketing salaries: marketing managers, digital marketing specialists and marketing executives.
This is where it got interesting, and where the real lesson of this post is.
There is no official, harmonised European dataset for marketing salaries. There are dozens of private salary sites, and they contradict each other dramatically. For a marketing manager in Germany, I found figures ranging from around €61,500 to €120,000 depending on the source. For Hungary, one well-known salary site suggests about 5 million forints a year, while a local survey puts the typical range at roughly 7 to 16 million.
Combine sources like that on one map and you get exactly what we started with: a beautiful, confident, wrong picture.
The only source I found that measures the same job titles with the same method across almost every European country is Paylab, the group behind sites like fizetesek.hu, platy.sk and platy.cz. Even there, the free data shows salary bands rather than averages, in different currencies, and in at least one country as net rather than gross pay. It can be done, but properly: one source, one method, every figure converted the same way, and the limitations written on the map.
That is the next step, and I will publish those maps once the data has been gathered and cleaned to the same standard.
What I take away from this
- A clean design is not a source. If a chart does not say where its numbers come from, assume nothing.
- Partly correct is the most dangerous kind of wrong. The accurate figures on the viral map are what made the inaccurate ones believable.
- Community feedback works. The Community Note and the people who replied on X were right, and it took about an hour with the original data to confirm it.
- Consistency beats volume. One reliable source with clear caveats is worth more than ten sources stitched together.
This is the same discipline we apply to analytics and server-side tracking at Trendfingers: before a number goes on a dashboard, you need to know where it came from and whether it means what you think it means.
If the numbers on your own dashboards look clean but you are not sure where they come from, that is exactly what our first review looks at. Request an audit.